Tuesday, March 29, 2016

GIS I Lab 4

Goal and Background: The goal of Lab 4 was to prove the understanding of how to use query expressions to find and use data from a particular database. The objectives included: using Boolean expressions, operators, and parenthesis to create many queries, use combination queries with attributes, and specifically map query results.


Methods: For numbers 1 through 3 (Part 1), I used the USA geodatabase from the Price mgisdata that was previously given to us. Add the counties shapefile from that geodatabase. Create a query under Selection > Select by Attributes to create the expression. The expression should include POP2010 > 3000 AND POP2010 < 4000 AND POP10_SQMI >= 1000. Create a layer from selected features to show clearly was has been selected on the map that is created of the continuous US next. Make sure the map includes Counties, Title, Legend, Map Scale and North Arrow.

For the number 2 repeat sections of number one but change the expression to (STATE_NAME = 'Wisconsin' OR STATE_NAME = 'Texas' OR STATE_NAME = 'New York' OR STATE_NAME = 'Minnesota' OR STATE_NAME = 'California') AND AGE_65_UP > 6500 AND MALES > FEMALES

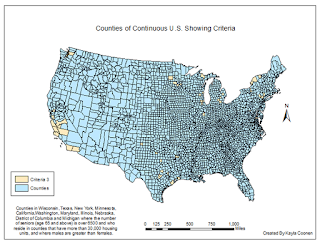
Number 3 is an addition to the expression for the query in number 2. The final expression should be (STATE_NAME = 'Wisconsin' OR STATE_NAME = 'Texas' OR STATE_NAME = 'New York' OR STATE_NAME = 'Minnesota' OR STATE_NAME = 'California' OR STATE_NAME = 'Washington' OR STATE_NAME = 'Maryland' OR STATE_NAME = 'Illinois' OR STATE_NAME = 'Nebraska' OR STATE_NAME = 'District of Columbia' OR STATE_NAME = 'Michigan' ) AND AGE_65_UP > 6500 AND HSE_UNITS > 30000 AND MALES > FEMALES

Part 2 (numbers 4-5) uses the Wisconsin geodatabase that was provided. Add counties, cities, and lakes shapefile.
Number 4 asks that the query (Selection > Selection by Attributes) contains the expression POP2007 > 15000 AND POP2007 < 20000 AND AREALAND > 5 AND FEMALE > MALE. Next go to  Selection > Selection by Location and change the selection method to 'select from the currently selected features,' the target layer should be lakes and the source layer should be cities. Then make sure the spatial selection is within the distance of the source layer feature by 2 miles. Create a map of the selection which should include county, roads, and lake layers, then the title, legend, map scale, and north arrow.

Number 5 uses the counties and rivers shapefile. Use the 'Select by Attributes' again to only select the CHIPPEWA R, EAU CLAIRE R, 'EMBARRASS R, FISHER R, HUNTING R, KINNICKINNIC R, MAUNESHA R, MILWAUKEE R, MOOSE R, NAMEKAGON R, PELICAN R, PLATTE R, and POTATO R. By using the 'PNAME' = 'CHIPPEWA R' OR 'PNAME' = ... etc. for all of the selected rivers. This map should be compiled of the Wisconsin counties, major roads, lakes shapefiles and the usual map essentials.


Results:
Continuous United States showing the criteria of the population between 3,000 and 4,000 people in 2010 and all the counties that had a population density of at least 1000 persons per square mile. 

Continuous United States focusing on the states Wisconsin, Texas, New York, Minnesota, and California where the male population is greather than the female population and includes the number of seniors (age 65 and up) that is over 6,500.

Continuous United States focusing on the states Wisconsin, Texas, New York, Minnesota, and California where the male population is greather than the female population and includes the number of seniors (age 65 and up) that is over 6,500. It also adds the states Washington, Maryland, Illinois, Nebraska, D.C. and Michigan that show the seniors and counties that have more than 30,000 housing units.

Cities in Wisconsin with a population between 15,000 and 20,000 people, area of the city is at least 5 square miles in land area, female population is greater than the males, and the those cities are within 2 miles of a lake.

Only shows the Chippewa, Eau Claire, Embarrass, Fisher, Hunting, Kinnickinnic, Maunesha, Milwaukee, Moose, Namekagon, Pelican, Platte, and the Potato River in Wisconsin. 


Sources:
  Price, Maribeth H.. Mastering ArcGIS (Seventh Edition). 

Wednesday, March 9, 2016

GIS I Lab 3

Goal and Background: The goal of this lab was to begin obtaining GIS and other standalone data that can be used for mapping and analysis. This gives experience in shifting a standalone table containing data into an attribute table so it can be mapped. This also starts off the use of data from the U.S. Census Bureau’s website in a bid to acquire information to be used in a GIS. In the end, create a static and dynamic maps. This will be done by downloading 2010 census data from the US Census Bureau, downloading a shapefile of the 2010 Census Boundaries, joining the data to it can be mapped, build a layout with the two maps, and create a web map.

Methods:
Download data about population per Wisconsin counties and the shapefile of Wisconsin counties from 2010 US Census Bureau.
Extract the Zip files that were downloaded from the online cite.
Add the shapefile and the table to ArcMap.
Join the MS Excel file to the shapefile by joining the GEO_ID field that the two tables both have.
Create a new field labeled population and make sure it is a long integer not a string data. This way there will be values to use. Then export the data to create a new shapefile labeled Population.
Go the symbology tab. Choose quantities and graduated colors and for the value choose population. Pick a color scheme that relfects the population of Wisconsin.

Go back to the US Census Bureau and choose another variable, I chose Occupied Housing Units in 2010. Download the MS Excel file for this one as well.
Once it is downloaded and extracted, create a new layer in ArcMap. Label the Layer housing. Include the shapefile of the population used in the previous layer. Add the MS Excel file into ArcMap, and join the data to the Population shapefile.
 In the properties, change the symbology of the new feature class to display the Occupied Housing Untis. Normalize the data with population. 
Change the projection of the layer to NAD_1983_Wisconsin_TM_US_Ft
Change from the Data View to Layout view. Place the two boxes next to each other so the Population layer and the Housing layer are side by side. Add a title, Legend, north arrow, and scale to each map. 

Only using the Housing layer, change it to the WGS 1984 Web Mercator (Auxiliary sphere) coordinate system. Sign into ArcGIS Online through ArcMap under File. 
Go to Save As, Service. Then give it a name, and check Feature Access. In the left pane of the Service Editor, click Item Description and enter a summary, tags and description for the service. Analyze it so there is no errors, then share it.

Using Google Chrome browser, Sign in to ArcGIS Online (http://www.arcgis.com/home). Under My Content the map that was just uploaded will be there. Click on it,
In the drop down arrow next to the name to click on 'Add Layer to Map.' Your map should lay on top of the topographic basemap.

In the Configure Pop-up window, Change the title to Occupied Housing Units, then click on Configure Attributes. Only have Name and Population selected, also make sure they are labeled County and Population. Click OK twice. Save the map to complete the Web Map.

Results:

Static Map of Population in Wisconsin per County and Occupied Housing Units based on Population


Web/Dynamic Map of Occupied Housing units based on the population of Wisconsin in 2010.


Sources: 
American Fact Finder. (2016, January). Retrieved from US Census Bureau: http://factfinder.census.gov/faces/nav/jsf/pages/index.xhtml

Price, M. H. (2016). Mastering ArcGIS. New York: McGraw-Hill Education .